

DIVERSITY AND INCLUSION
As a company, we are building a diverse and inclusive environment where people feel safe, respected, valued, and free to create and innovate. For this reason, we have created and introduced our Diversity and Inclusion Policy with the People and Organization department.
As a company, we are building a diverse and inclusive environment where people feel safe, respected, valued, and free to create and innovate. For this reason, we have created and introduced our Diversity and Inclusion Policy with the People and Organization department.
EMPLOYEES BY AGE RANGE
| 2020 | 2021 | 2022 | 2023 | |||||
| N° | % | N° | % | N° | % | N° | % | |
| < 30 years old | 3,867 | 19.69% | 4,126 | 25.08% | 4,955 | 21.18% | 5,229 | 20.63% |
| 30 to 60 years old | 15,020 | 76.47% | 15,180 | 92.30% | 17,420 | 74.47% | 19,051 | 75.12% |
| > 60 years old | 754 | 3.84% | 762 | 4.63% | 1,016 | 4.34% | 1,071 | 4.22% |
WOMEN BY TOTAL NUMBER OF DIRECT EMPLOYEES
| 2019 | 2020 | 2021 | 2022 | 2023 | |
| Percentage of total | 15.4% | 16.8% | 23.3% | 9.92% | 21.5% |
WOMEN ACCORDING TO ROLE
| 2022 | 2023 | 2025 Goal | |
| Percentage of women in the entire labor force | 19.9% | 21.5% | 25% |
| Percentage of women in all management positions | 25.6% | 27.0% | 30% |
| Percentage of women in junior management positions | 18.1% | 26% | - |
| Percentage of women in senior management positions | 36.8% | 40.4% | - |
| Percentage of women in income-generating management | 12.5% | 24.62% | - |
| Percentage of women in CITM (science, engineering, technology and mathematics) positions | 20.3% | 22.99% | - |
The categories presented here correspond to the S&P methodology for its DJSI index, you can review other categories in our 2023 integrated report.
EMPLOYEES WITH DISABILITIES
| 2019 | 2020 | 2021 | 2022 | 2023 | |
| Porcentaje | 1.0% | 1.1% | 1.29% | 1.7% | 1.5% |
We aim to reach 2,5% of the workforce with people with disabilities by 2025
Goal 10.2:
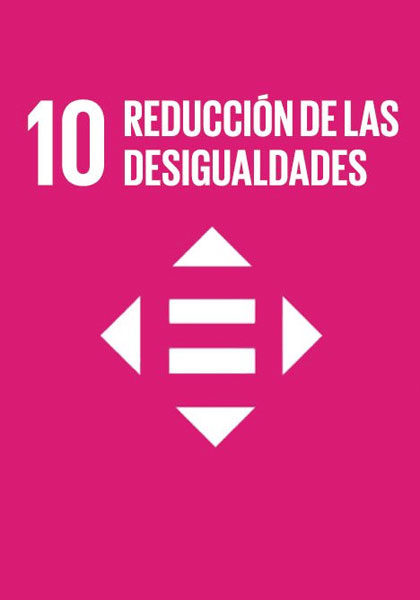
By 2030, empower and promote the social, economic, and political inclusion of all people, regardless of age, gender, disability, race, ethnicity, origin, religion or economic, or status.
| 2019 Baseline | 2020 | 2021 | 2022 | 2023 | Goal by 2025 | |
| Percentage of people with disabilities | 1.0% (170 pers.) | 1.1% (219 pers.) | 1.29% (279) | 1.7% | 1.10% | 2.5% |
| Annual variation (%) | – | 0.1% | -0.1% | -0.2% | 1.5% | -0.12% |
| Percentage of progress towards goal | – | *6.6% | -13.5% | -20.1% | -18.18% | 100% |
Note: This goal includes the Pulp and Biopackaging businesses. Figures do not include Softys